Air pollution. Causes and trends of greenhouse gases
What are the causes of air pollution? What are the main greenhouse gases? Has there been a reduction over the years in our country? If yes, to what extent? In this article we will address the trend of greenhouse gas emissions in Italy, looking at what has been done so far and what still needs to be done.
What are the main causes of air pollution
Without claiming to be exhaustive here, let's briefly mention the main causes of air pollution. For further information, we refer you to the series of articles dedicated to the environment in our Magazine.
First of all, it should be remembered that the sources of pollution are divided into primary, i.e. released into the air directly from a source (for example CO from oxygen-deficient combustion), and secondary. The latter are due to the recombination of primary pollutants, this is the case for example with ozone.
Secondly, it is important to point out that there are natural and artificial sources of pollution, the latter, as they are caused by man, are the ones on which we can intervene.
After these clarifications, let's see some of the main sources of air pollution:
- Burning of fossil fuels
- Biomass combustion
- Emissions from industries and factories
- Heating of buildings
- Chemical and petrochemical plants
- Agricultural activities
- Transport
- Mining
This obviously brings us directly to the topic of greenhouse gases, i.e. those gases that are responsible for raising the planet's temperature.
What are greenhouse gases
Certainly the best known of the greenhouse gases is carbon dioxide (CO2), the others are methane (CH4), nitrous oxide (N2O) and hydrofluorocarbons (HFC), i.e. the most widespread refrigerant gases on the market today. Normally in measuring the impact of greenhouse gases, is used as a unit of measurement. CO2 equivalent (CO2 eq), which measures how much a certain quantity of greenhouse gas is equivalent in CO2.
From 1990 to 2018, how Italy behaved
Let's start by saying that total greenhouse gas emissions in our country, expressed in CO2 eq, fell by 17.2% from 1990 to 2018.
Let's go into details starting from CO2 which represents approximately 81.4% of total greenhouse gas emissions . In this case the decrease was 20.5%. The following graph is particularly significant as it shows the decoupling between energy consumption/GDP and CO2 starting from the second half of the first decade of the 2000s.
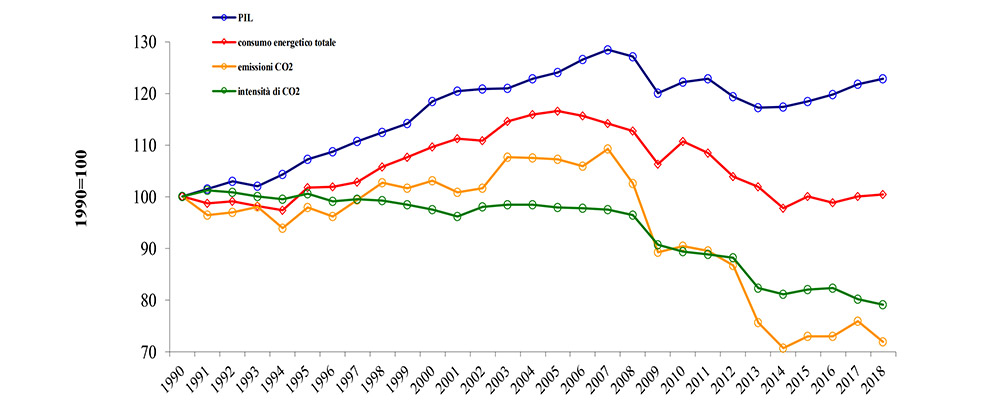
While up until around 2007 there was growth in GDP, energy consumption and related CO2 emissions, since the economic crisis of 2008 we have seen the simultaneous collapse of the three indicators. However, with the economic recovery, unlike what could be expected, CO2 emissions do not recover , on the contrary, they continue to fall. The main reason is the gradual replacement of fuels with a high carbon content, such as oil and coal, with methane gas and renewable energy.
Let's now look at methane, nitrous oxide and hydrofluorocarbons. The CH4 represents 10.1% of total emissions and saw a decrease of 10.8% in the period considered. N2O amounts to 4.1% of the total and the decrease in its emissions is equal to 32%. The emissions of HFCs , although representing 3.9% of the total, are the ones that cause concern, as they are the only ones going against the trend, with a marked increase in emissions.
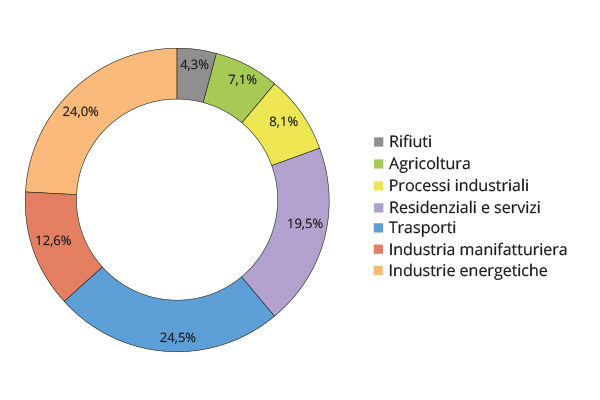
Below we report the graphs of greenhouse gas emissions by sector.
What is the European objective regarding greenhouse gases
Climate change is among the global emergencies with the highest priority, and a further acceleration in this sense is coming from the post-Covid recovery plans of the European Union, but also of the United States, which envisage large investments for decarbonisation.
Following the Paris Agreement , which sees the commitment of the countries to contain the increase in global temperature to 1.5 °C compared to pre-industrial levels and implement national general plans to achieve the objective of eliminating greenhouse gas emissions. As of the century, the European Union has revised its objectives more stringently, bringing the reduction of greenhouse gases from 40 to 55% compared to 1990 to be achieved by 2030.
At the same time, it is planned to increase energy efficiency by 27% and reach a renewable energy share of 27% of the total.
Covid effect, what it teaches us
While awaiting the release of the ISPRA reports updated for the year 2020, which will therefore see the effect of Covid on emissions , some estimates are already available for the first quarter of 2020 and report a drop of 5-7% compared to the same period of 2019. The reductions are mainly due to the transport sector and to a lesser extent by the heating sector and energy consumption due to the blocking of production activities.
When we have the definitive data we will be able to know if Italy has managed to achieve the objectives set for 2020 and what the estimates are for 2030, also in light of the measures that will be implemented with the PNRR.
Certainly what needs to be underlined is that the emission reduction effect due to Covid does not constitute a contribution to resolving the climate emergency as what we need, as is now clear, is structural measures . Furthermore, measures which when applied, as has been the case over the years that we have examined in this article, show that a path towards improvement is possible.