Air pollution: Greenhouse gas causes and trends
What are the causes of atmospheric pollution? What are the main greenhouse gases? Has there been a reduction over the years in our country? If so, to what extent? In this article, we will address the trend in greenhouse gas emissions in Italy, looking at what has been done so far, and what remains to be done.
What are the main causes of atmospheric pollution?
Without pretending to be exhaustive here, let’s make a brief mention of the main causes of air pollution. To learn more, we recommend the series of articles dedicated to the environment in our Magazine.
First of all, it should be remembered that the sources of pollution are divided up between primary sources, that is, introduced into the air directly from the source (e.g. CO from combustion lacking in oxygen), and secondary sources. The latter are due to the recombination of primary pollutants, such as ozone.
Secondly, it should be noted that there are both natural and artificial sources of pollution. The latter, as they are caused by humans, are those we can actually do something about.
After these clarifications, let’s see some of the main sources of atmospheric pollution:
- Combustion of fossil fuels
- Combustion of biomass
- Emissions from industries and factories
- Heating of buildings
- Chemical and petrochemical plants
- Agricultural activities
- Transportation
- Mining
This obviously brings us directly to the issue of greenhouse gases, that is, those gases that are responsible for raising the temperature of the planet.
Which gases are greenhouse gases?
Surely the best known of the greenhouse gases is carbon dioxide (CO₂). The others are methane (CH₄), nitrous oxide (N₂O), and hydrofluorocarbons (HFC), which are the most common refrigerant gases used on the market today. Normally, in measuring the impact of greenhouse gases, the unit of measurement used is CO₂ equivalent (CO₂eq), which represents how much CO₂ is equivalent to a certain amount of greenhouse gas.
From 1990 to 2018, how Italy behaved
Let’s start by saying that the total emissions of greenhouse gases in Italy, expressed in CO₂eq, fell by 17.2% from 1990 to 2018.
Let’s go into the details, starting with the CO₂, which represents about 81.4% of the total greenhouse gas emissions. In this case, the decrease was 20.5%. The graph below is particularly significant, as it shows the decoupling between energy consumption/GDP and CO₂ from the second half of the first decade of the 2000s.
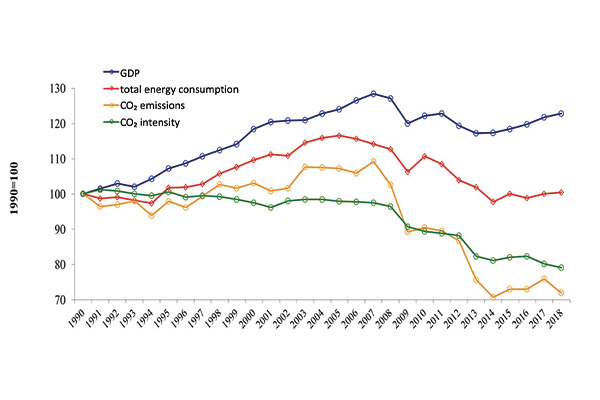
While until around 2007 there was a growth in GDP, energy consumption and related CO₂ emissions, since the economic crisis of 2008, we have seen a simultaneous collapse in the three indicators. With the economic recovery, however, contrary to what one might expect, CO₂ emissions have not picked up, on the contrary, they continue to decline. The main reason is the gradual replacement of high-carbon fuels, such as oil and coal, with natural gas and renewable sources of energy.
Let’s now take a look at methane, nitrous oxide, and hydrofluorocarbons. CH₄ represents 10.1% of total emissions, and has seen a decrease of 10.8% in the period considered. N₂O accounts for 4.1% of the total, and the decrease in its emissions is equal to 32%. The emissions of HFC, while only representing 3.9% of the total, are those of most concern, as they are the only ones going against the trend, with a marked increase in emissions.
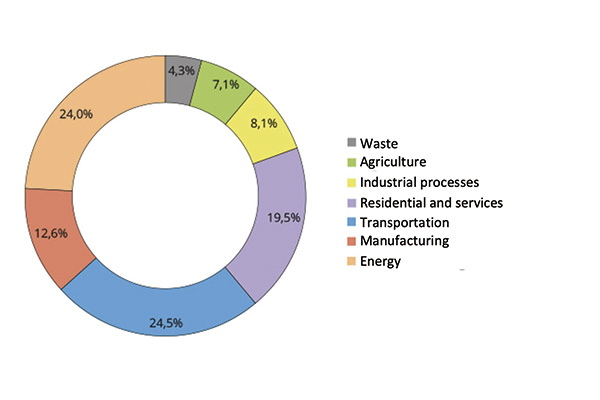
Following are the graphs of greenhouse gas emissions by sector.
What are the European targets for greenhouse gases?
Climate change is among the global emergencies of the highest priority, demanding greater attention in the post-Covid recovery plans of the European Union, but also of the United States, for which large investments in decarbonisation are foreseen.
Following the Paris Agreement , which saw the commitment of countries to limit the global temperature rise to within 1.5°C compared to pre-industrial levels, and to implement national plans to achieve the goal of eliminating greenhouse emissions by the end of the century, the European Union has revised its objectives more stringently, to increase the cutting of emissions from 44% to 55%, compared to 1990 levels, to be achieved by 2030.
At the same time, the plan is to increase energy efficiency by 27%, and achieve a share of renewable energies over the total equal to 27%.
The Covid effect, what it has taught us
Pending the release of the reports of the Italian Institute for Environmental Protection and Research (ISPRA) updated to 2020, which will therefore show the effect of Covid on emissions, some estimates are already available for the first quarter of 2020, indicating a decrease of 5 to 7% compared to the same period in 2019. The decrease is mainly due to the transport sector, and to a lesser extent to the heating and energy consumption sector, due to slowdowns in manufacturing activities.
When we have the final data, we will be able to know if Italy has managed to achieve the objectives set for 2020, and what the estimates are for 2030, also in light of measures that will be implemented through the National Recovery and Resilience Plan.
Certainly what should be emphasized is that the emission reduction effect due to Covid will not contribute to the resolution of the climate emergency, as it is now clear that what we need is structural measures. Measures that, when applied, as in the years we have examined in this article, show that a path to improvement is possible.